

My analysis of a messed up HPV vaccine study, and a link to a new one making the rounds.

Introduction
Igor Chudov, who has a great substack that I follow, published an article about a study on an HPV vaccine that supposedly had shown a decrease in risk of preterm births, but it turned out to be an increase in risk (someone had made an error in the article. Here is the link:
www.igor-chudov.com/p/retracted-nz-study-proved-hpv-vaccine
This is actually an old article of mine, but it’s not in my list of articles, and I think it was a very early one that was in a different account that had almost no subscribers.
The Study
I found a study that supposedly shows there is no relationship between the quadrivalent gardasil vaccine and POTS (postural orthostatic tachycardia syndrome), CRPS (complex regional pain syndrome) and CFS (chronic fatigue syndrome).
https://www.ncbi.nlm.nih.gov/pmc/articles/PMC7463169/#idm140123106388112title
To say it is fatally flawed is an understatement. It shows a very strong relationship between the vaccine and POTS (postural orthostatic tachycardia syndrome).
It looked at Danish girls and women in a national registry from 2007 to 2016.
It had a total of 530K girls and women who were vaccinated, of which 155 developed POTS, for a rate of 29.3 per 100,000.
It had a total of 811K girls and women who were not vaccinated for any HPV vaccine in the timeframe of the study. 43 of these developed POTS, for a rate of 5.3 per 100,000.
The total number of cases of POTS is 198.
I am not good at figuring the 95% CI (confidence interval) on risk, but a relative risk of 29.3 / 5.3 = 5.52 should have a confidence interval with the lower bound well above 1.
So, that should have been it, right? A clear signal of causation? Nope. They didn't publish those numbers in the study. All they used the population of 1.3 million girls and women for was to calculate the age of diagnosis and time from vaccination to diagnosis. For POTS they note that a a median time of 2.95 years elapse between vaccination and diagnosis.
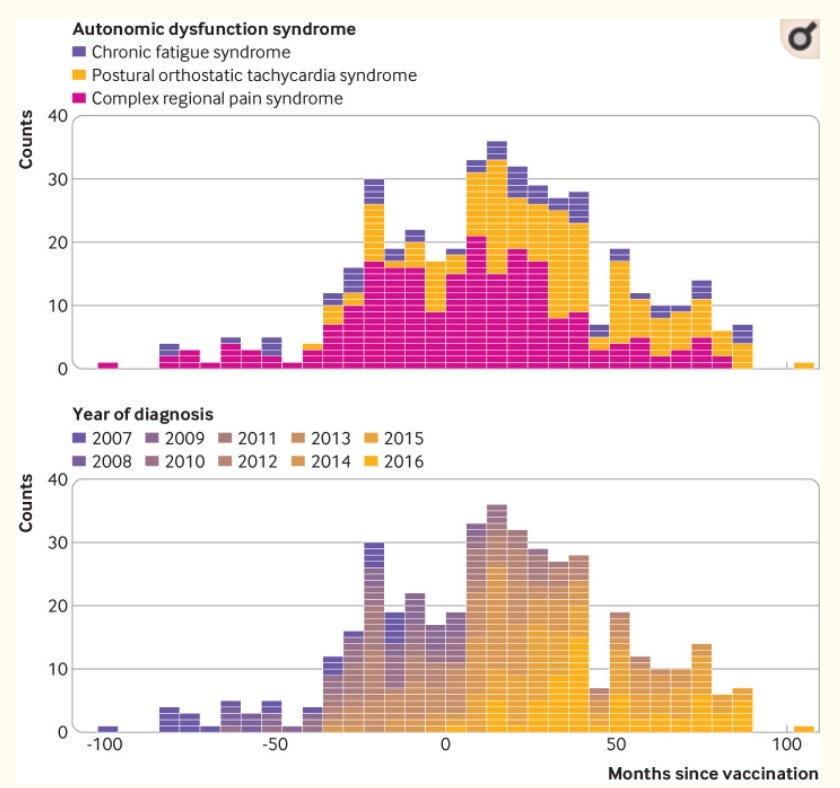
There is a graph in the study, showing how many months before or after vaccination each person was diagnosed with one of the syndromes. If you look at the POTS data in the chart you can eyeball it and clearly see that the great majority of POTS diagnoses occur after vaccination. There are 155 yellow squares (representing POTS diagnoses) in the graph, and counting them shows that 28 of these cases happened before vaccination, and 127 cases occurred afterwards.
The authors decided to do their analysis on a "self-controlled case series analysis" basis, which I am pretty sure is not appropriate for this kind of data. They decided that ONLY diagnoses that happened within a year of vaccination counted for their purposes, despite POTS being diagnosed an average of 2.95 years later.
They ONLY looked at the 869 girls and women who developed one of the three syndromes. They then, for each syndrome, divided the cases where the syndrome occurred within 0 and 12 months after vaccination on one side and all other cases (syndrome occurred before vaccination or at least 12 months after vaccination, or not vaccinated) on the other side.
For POTS, this meant they looked at 19 cases with diagnosis within a year after vaccination, and the other 179 cases with a diagnosis of POTS, for 198 total.
I have no idea how they did this, but they counted "person years" of exposure for each of these two tiny groups.
For POTS, their diagnosis-within--less-than-one-year-of-vax group had 19 cases and 226 person-years of exposure, for a risk of .0841.
The other group had 179 cases and 1393 person-years of exposure, for a risk of .1285.
They apparently divided .0841 by .1285 and got .59, although my math says it's .654.
On THIS they decided that the HPV vax does not cause POTS (postural orthostatic tachycardia syndrome).
What's more, the study does NOT say the 811K girls and women were not vaccinated with some other kind of HPV shot before the study onset. I'd be suspicious of that, since the rates of complex regional pain syndrome and chronic fatigue are quite similar between the two groups.
This study is still not showing as retracted.
Thanks for that analysis, the ways these studies can be and are corrupted is vast. It takes a lot of time and effort to look through them and find the flaws/fraud. I don't enjoy anything to do with numbers and I'm not good at it so I'm delighted to find your work.
Total Vaxd: 530,000
Tested positive to POTS? Y: 155, N: (530,000 - 155) = 529,845
Odds of testing positive = 155/529,845
----
Total Unvaxd: 811,000
Tested positive to POTS? Y: 43, N: (811,000 - 43) = 810,957
Odds of testing positive = 43/810,597
----
Odds Ratio (Vaxd compared to Unvaxd) = (155/529,845) / (43/810,597) = 5.52
Confidence Interval (95%) in excel language...
= exp (ln(5.52) -/+ 1.96 * (1/155 + 1/529,845 + 1/43 + 1/810597)^.5)
= (3.93, 7.93)
That has a p value of <0.0001
----
Little online calculator here: https://www.medcalc.org/calc/odds_ratio.php
----
The issue would be controlling for everything else. The vaxd probably had a million other vaxes.